ABSTRACT
The purpose of this document is to guide STRAP users to apply various modules of the software to model, analyze and design a Pedestrian Bridge. Note that the loading magnitudes and results output might not be close to the expected output in reality. This document Prepared by Elisha. P. Tungamirai BEng Hons Civil (NUST).
The document will equip the user to understand the following concepts in STRAP:
- Geometry Definition
- Bridge Load Definition
- Interpretation of Output Results
- Post Tensioning
- Dynamic Analysis
DESCRIPTION OF BRIDGE
The pedestrian bridge example consists of an overall length of 60m, 3-span simply supported reinforced concrete 15m jack spans, and a 30m post-tensioned center span supported on reinforced concrete piers and closed cantilever type abutments with return walls. The jack spans are supported on abutments and piers with laminated elastomeric bearing pads. The deck reinforced concrete upstands are cast monolithic with the bottom slab and act as pedestrian parapets. There are parametric variations on the parapets along the length of the bridge for all the 3 spans. Both the abutments and piers are founded on Augur piles. For the safety of pedestrians and under passing traffic the bridge is enclosed in a galvanized steel cage attached to the sides of the deck and the bridge skew is 0°.

Figure 1 Full Bridge Render (Beam Model)

Figure 2 Typical Deck Cross Section
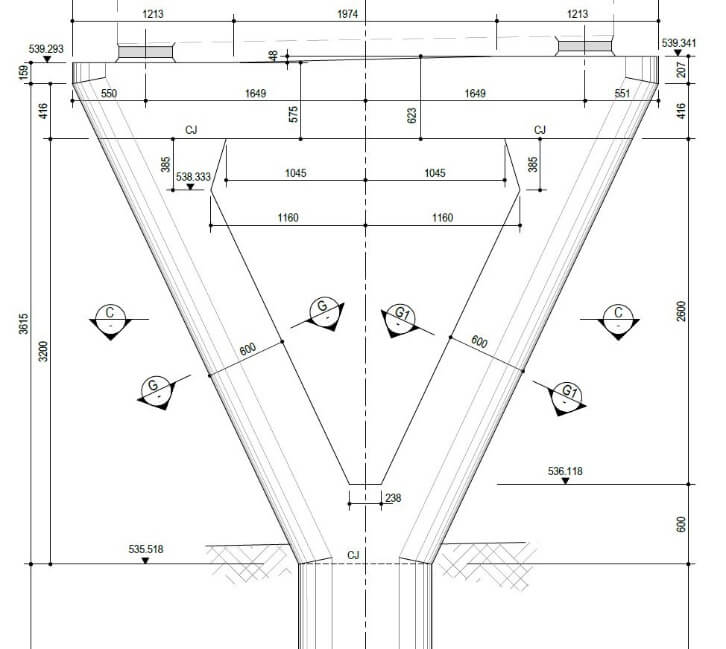
Figure 3 Typical Pier Elevation
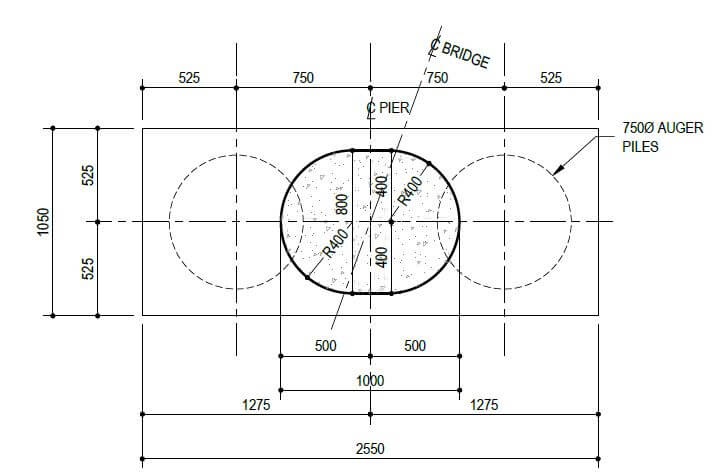
Figure 4 Pile Cap Plan

Figure 5 Pile Cross Section C-C
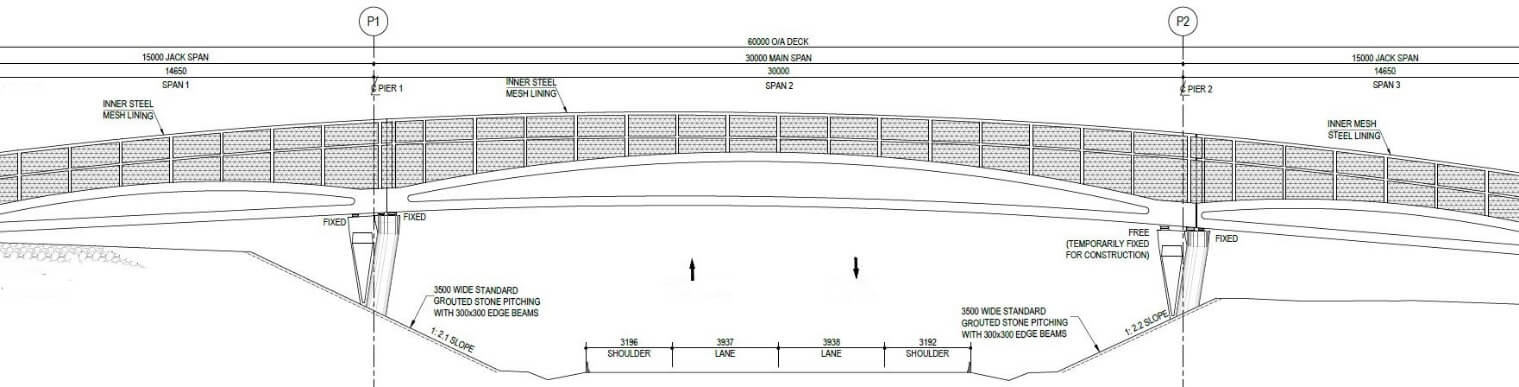
Figure 6 Deck Elevation Profile
GEOMETRY DEFINITION
Modelling Parameters & Assumptions
The bridge deck overall width is 3.5m and the parapets height varies with length. On jack spans, the overall depth is 1.5m at its highest point (span center) and 0.5m on approaching the abutments in the form of an arch with radius 41m, on center span, the overall depth is 2.0m on the highest point (span center) and reducing to 0.5m over the piers in the form of an arch with radius 65m. Below is a list of other parameters associated with the analysis of the bridge:
- Bridge spans (m) = 15m, 30m, 15m.
- Deck width (m) = 3.5m.
- Piles diameter (m) = 0.75m.
- Pile length from Pile cap soffit (m) = 4m.
- Pile Cap dimensions (m) = 2.55m (L) x 1.05m (W) x 0.75m (H).
- Piers overall length (m) = 7.2m (Deck soffit to pile cap T.O.C).
- RC Unit Density (KN/m³) = 25KN/m³.
- Modulus of Subgrade Reaction (Ks) = 50 000KN/m³.
- Deck, Pier & Piles concrete strength (fcu) = 40, 50, 50 MPa.
- Reinforcement yield stress = 450MPa.
- RC Modulus of Elasticity = 31GPa (Grade 40) & 35GPa (Grade50).
- Reinforcement Modulus of Elasticity = 200GPa.
- Creep coefficient for loading = 2.5.
- Coefficient of thermal expansion for RC = 0.00001.
- Reinforced Concrete Poison Ratio (v) = 0.2.
- Earthquake ground acceleration coefficient (k) = 0.06.
- Elastomeric Bearing vertical stiffness = 420KN/mm.
Prestressing Design Data:
- Coefficient of friction = 0.25
- Wobble factor = 0.0020/m
- Shrinkage factor = 0.0003
- Creep factor = 2.5
- 1000 hr relaxation at 70% guts = 45 MPa
- Total assumed relaxation = 72 MPa
- Wedge slip anchorage = 10 mm
- E-modulus of prestressing steel = 198 GPa
MODELLING STEPS
This example will demonstrate modelling of the bridge using beam elements for the bridge deck, piers & piles. Pile caps are modelled using plate elements. However, modelling the deck using beam elements has limitations on performing transverse analysis, a separate plate elements model is produced for the deck transverse analysis. Beam elements are quicker to generate, and since the center span is post tensioned, it is faster to incorporate post tensioning tendons with a beam elements model.
Step 1: Node definition
Change the display plane on the toolbar to X1-X3 for insertion of deck support nodes i.e for abutments and piers supports, since the bridge comprises of 3 spans, 4 nodes varying in the X1 direction are created. The 4 nodes spaced 15m, 30m and 15m, respectively. The distance between the first and last node should be 60m. The soffit of jack spans varies linearly from support to support (first & second node). For the center span, deck soffit follows a circular vertical alignment with a radius of 225m. To achieve this, the coordinate system is changed to cylindrical for defining the two center span nodes (second & third node).
The other internal nodes are quickly generated using the line of equality function to get equal 1m divisions of the bridge deck. Since there is a linear variation on jack spans deck soffit, the coordinate system is reverted to X1-X3 working plane for offset of jack span nodes 15m on either side and again using line of equality function to subdivide the jack span into successive 1m elements.
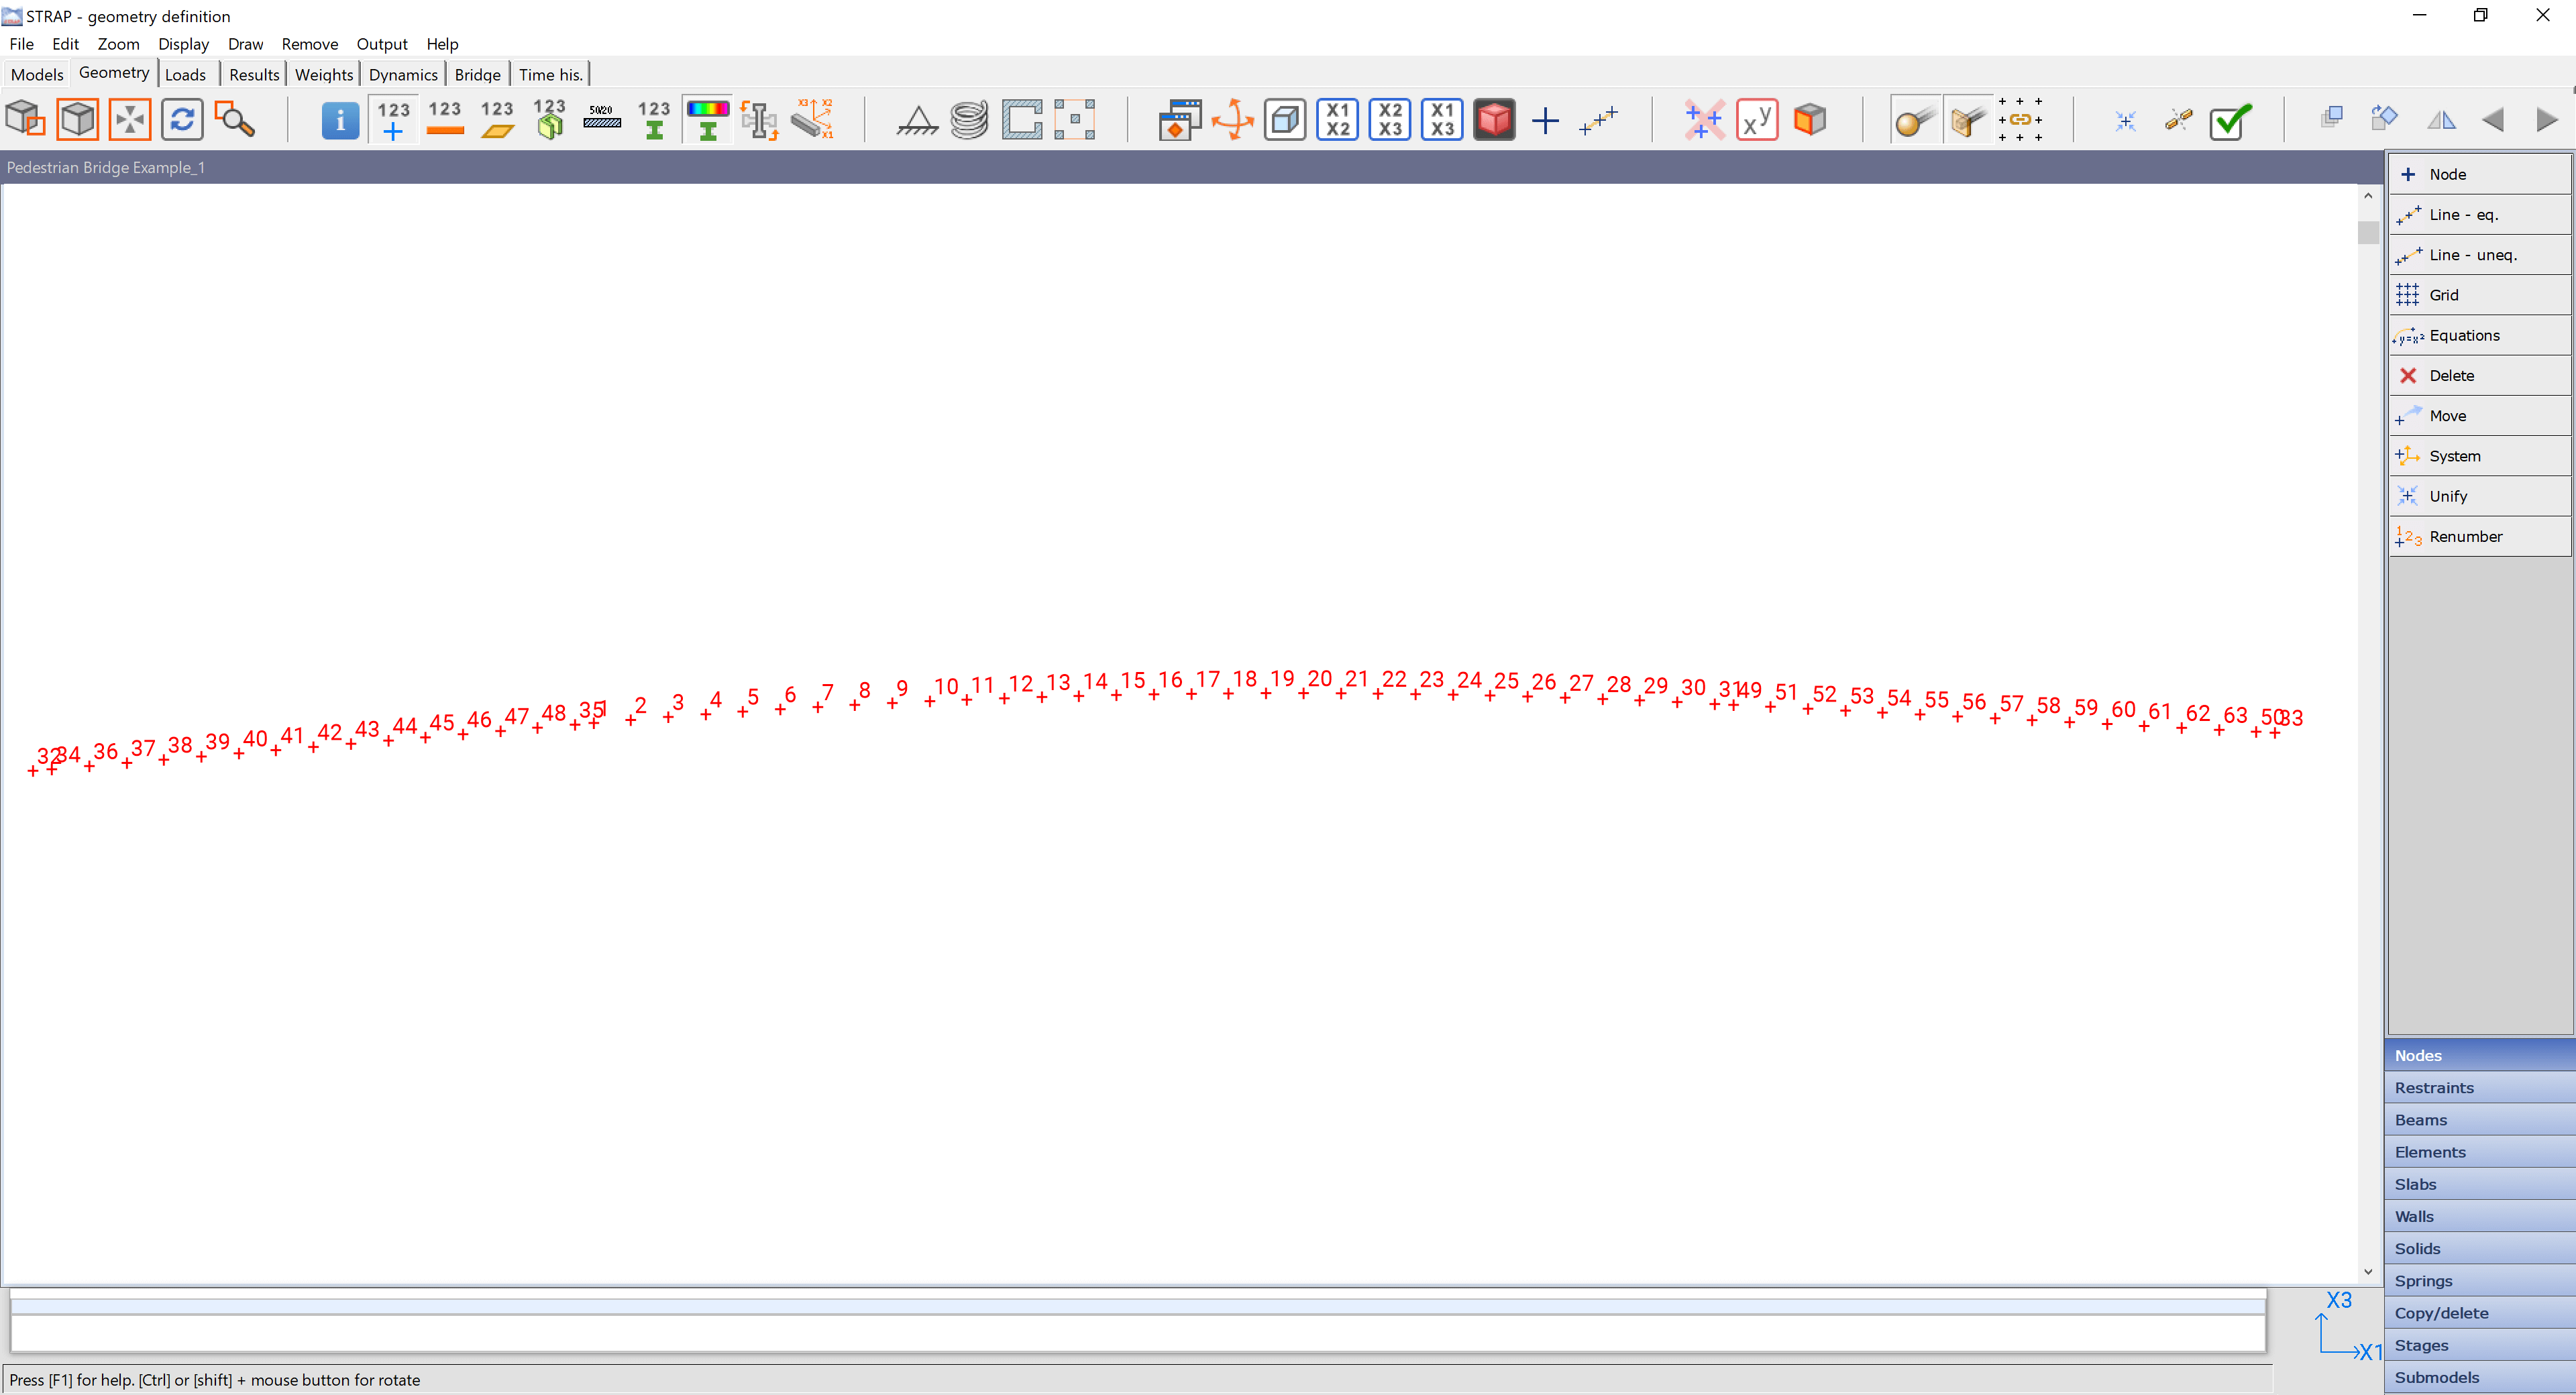
Figure 7 Node Definition
Step 2: Beam definition
Create beam elements joining all the nodes. By selecting define beam elements, click on split at intermediate nodes, jack spans can be defined by connecting the first and last node. STRAP will automatically subdivide the beam on all the earlier generated internal nodes. For the center span, by virtue of it being an arch, select arc of beams to define the beam. Once the beams definition is complete as shown in Figure 7, next step is assigning beam properties.
Deck cross sections are imported from a DXF file into CROSEC. The deck is symmetrical about the center of the main span, only half of the numerous deck sections are imported as shown Figure 8 using Output on CROSEC toolbar, and cross sections are imported to STRAP using copy to clipboard function.
An alternative way of importing sections to STRAP is to save all deck cross sections generated in CROSEC, instead of copying to clipboard, use beam properties > define/revise > more > from library and highlight the sections to import. Note that another alternative takes advantage of the predefined parametric section in STRAP for the U frame under beam properties > define/revise > more > U section, which is quicker at generating sections using taper, but in this example, deck parapets are not purely rectangle, the taper feature will not be able to generate an accurate profile, the parapets form a vertical arch profile.
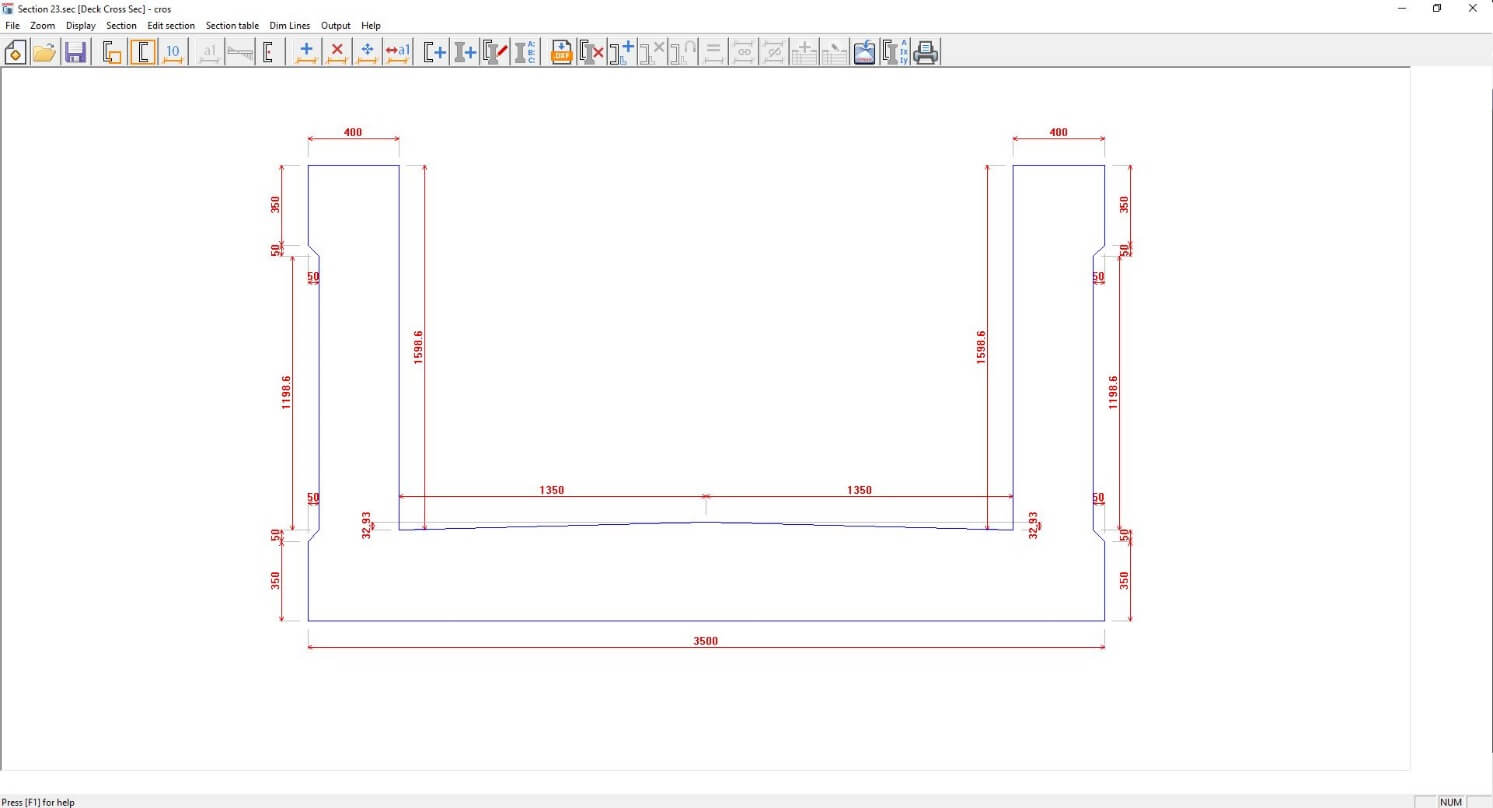
Figure 8 CROSEC import from DXF.
The jack and center spans have a total of 23 sections which ought to be exported to STRAP from CROSEC. Once all the cross sections have been successfully imported to STRAP as shown in Figure 8, the various beam properties are assigned to various beam elements.
The following should be carefully noted:
- Orientation of the deck section should be in the X2 – X3 plane as shown in Figure 8 and section major direction should be I2>I3. All these changes are implemented on section definition.
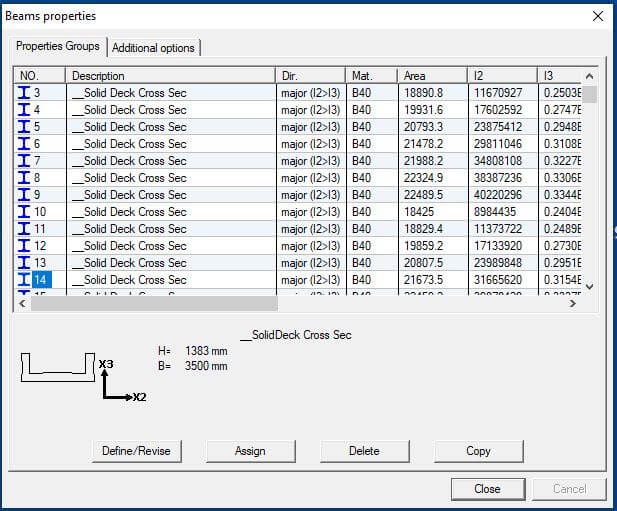
Figure 9 Beam Properties
- Local x1 axis along beam length should point in the same direction for all beams in span to avoid sections being wrongly oriented, this can be confirmed on the toolbar Display> Local axis Please refer to Figure 10.
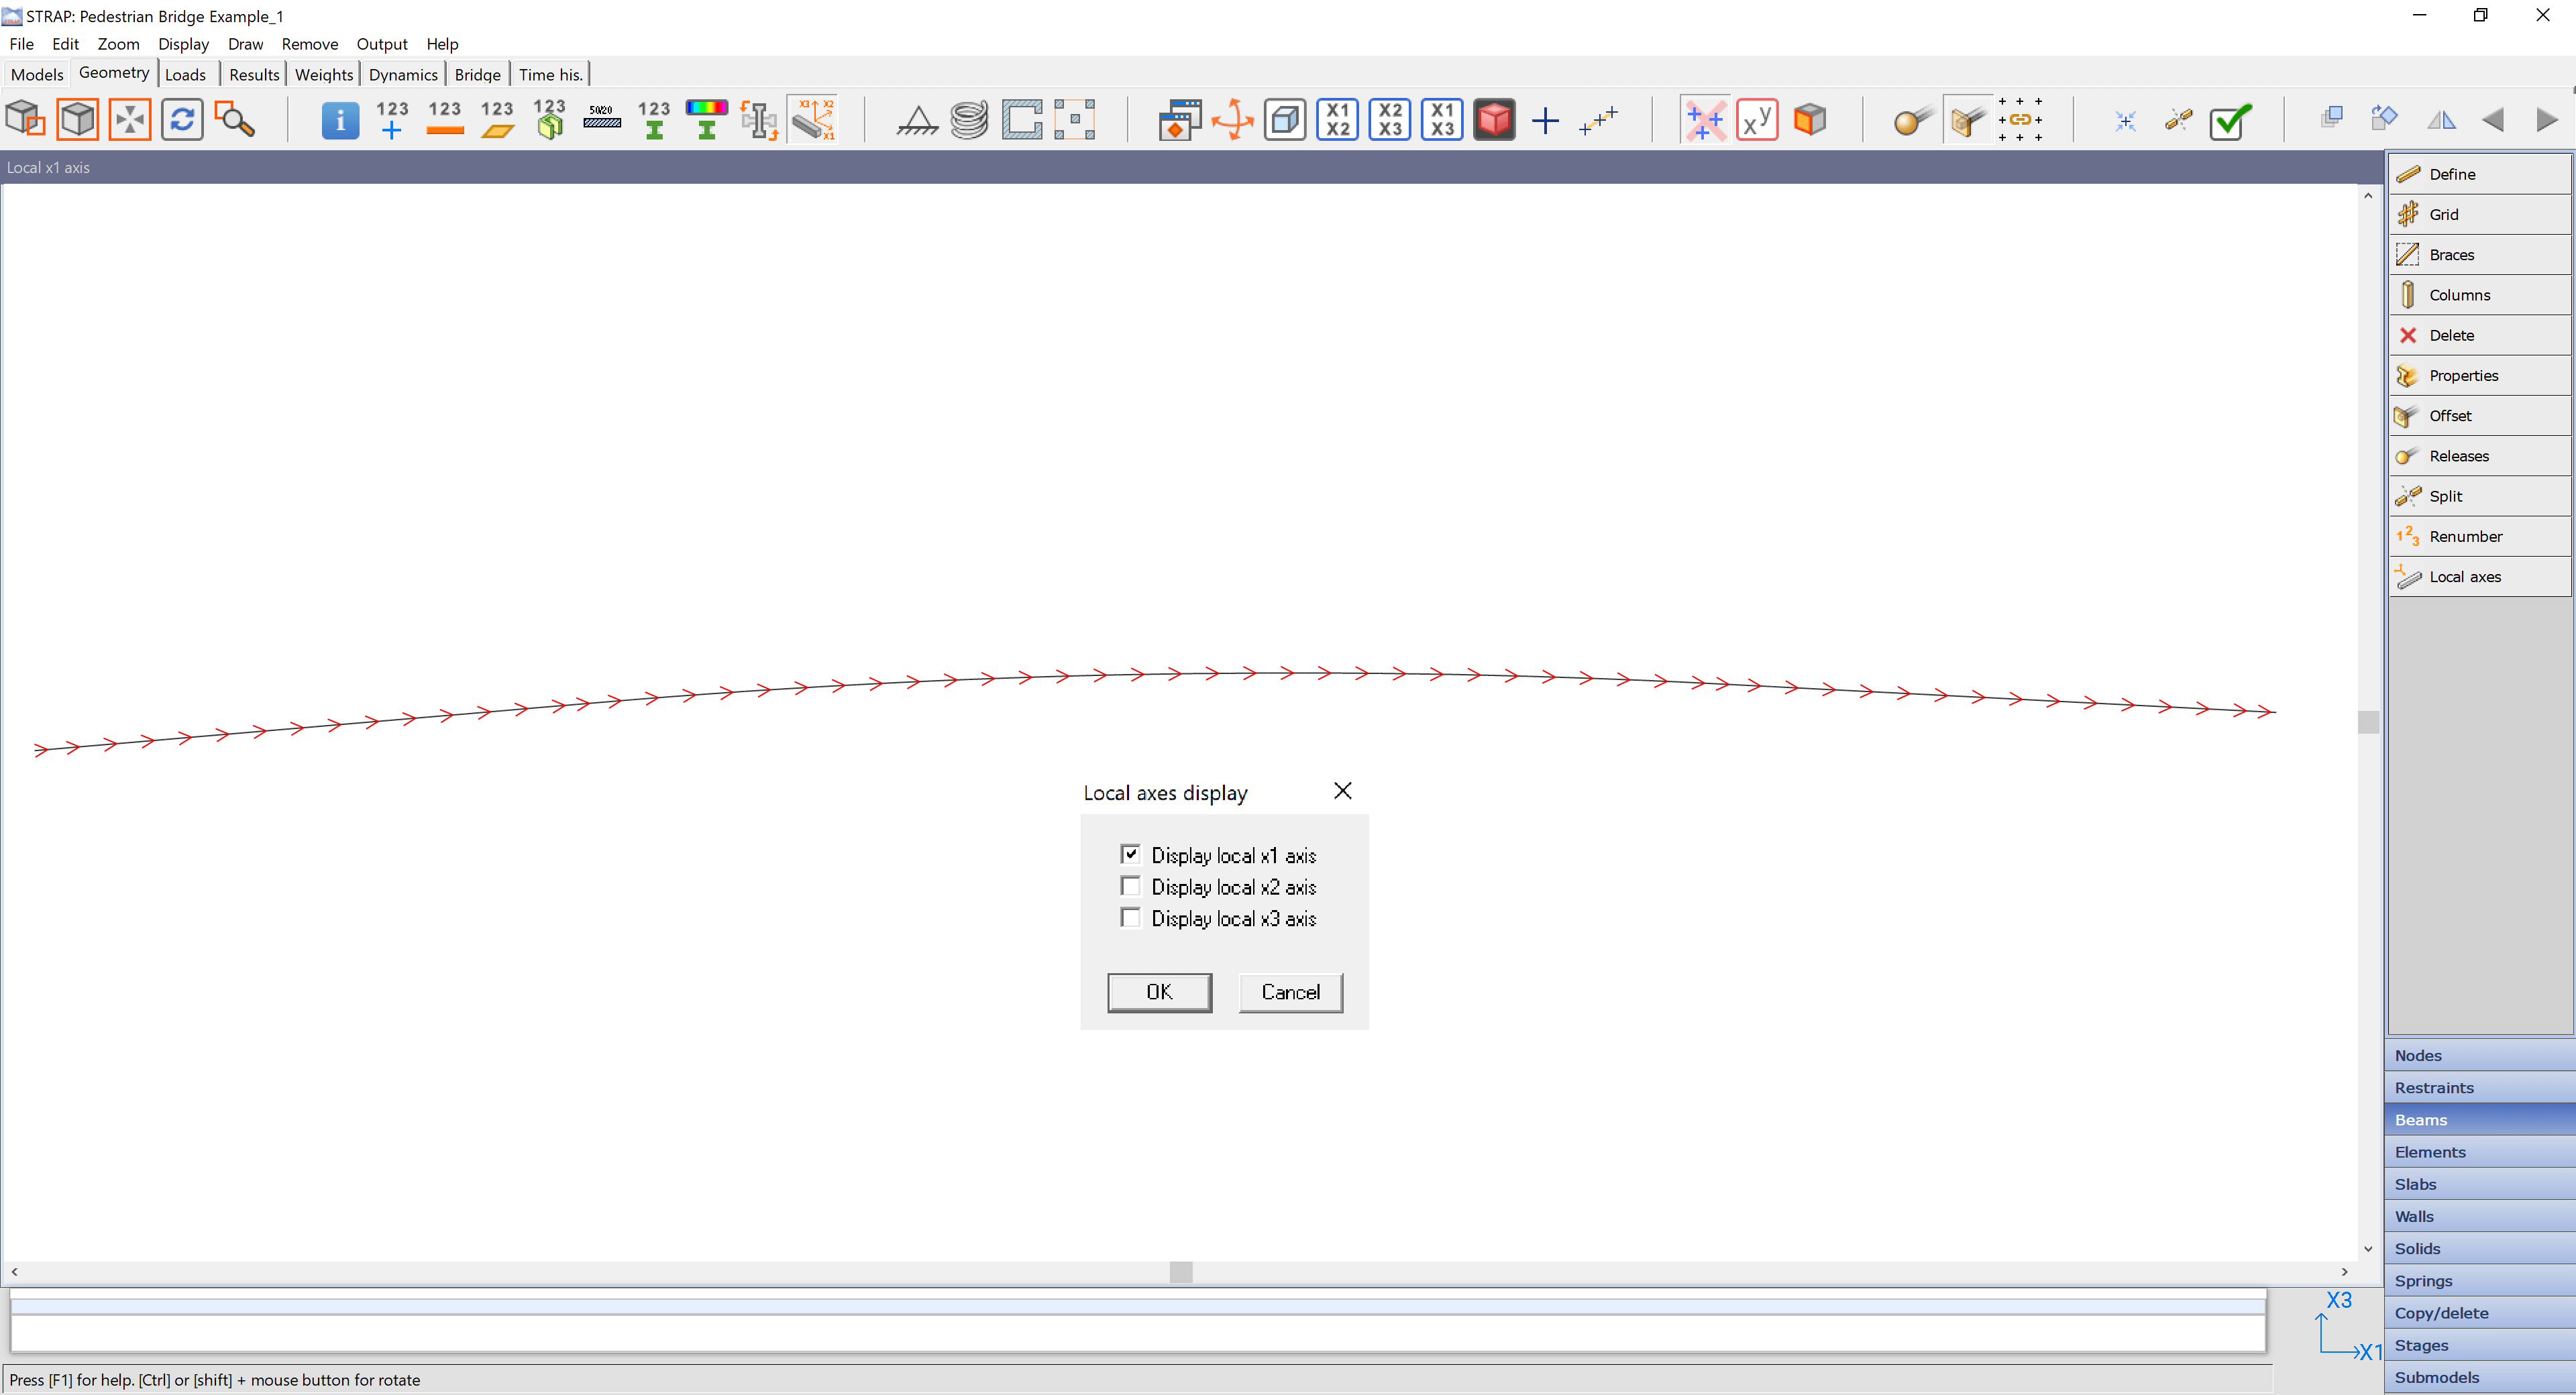
Figure 10 Local Axis Orientation
Step 3: Beam offsets
After assigning the beam properties to all beams, render the model. Notice that the sections do not form the intended profile. This is due to STRAP connecting the centroids for the individual sections. This is rectified under Beam offsets > Align Beam faces > Global +X3 > Selecting the reference beam > selecting the rest of the beams to be aligned. Following the steps above, proceed to render the model, the deck profile should appear as shown in Figure 1 and excluding the substructure elements.
Step 4: Moment releases and rigid links
The next step is applying moment releases (M2 & M3) on beams over the piers. The reason for introducing moment releases is emanating from the fact that the 3 spans are simply supported and not cast monolithic with the sub structure. There is an expansion joint between the spans to allow for lateral movements, hence there is no moment transfer between deck & piers. Figure 11 shows the table for moment releases. The circles on beam ends on Figure 10 indicate moment releases introduced on beam elements.
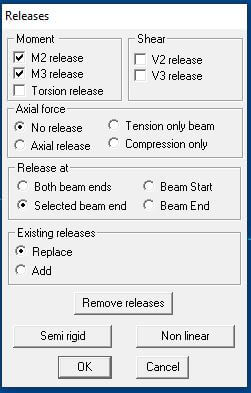
Figure 11 Moment Releases
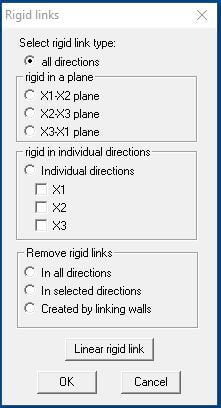
Figure 12 Rigid Links
Step 5: Laminated elastomeric bearing definition
The elastomeric bearings are located 1.5m from the longitudinal deck center in line with support nodes along the X2 axis. For the other node positions, use the copy command under nodes to offset the elastomeric bearing positions from the deck center for both piers and abutments. Copying the nodes on supports, 1.5m to the left and right of the bridge deck enables the establishments of the elastomeric bearing positions relative to the deck. However, the hurdle is, no link will be established between the two nodes (original and copy) but in practice, there should be transfer of the shear and torsion forces to the bearings.
To achieve the desired outcome, a rigid link is introduced between the 3 nodes. The central node (original) being the master node transferring forces to the slave nodes (copy). This can be located under, Restraints > Rigid links, kindly refer to Figure 12 for rigid links definition. For the purpose of this example, select rigid link in all directions, since a moment release was introduced on the deck, hence no moment transfer to the substructure. In addition, introduce (M2 release only) on the bearings so that the connection transfer axial & shear forces only. Note that M3 cannot be released on the elastomeric bearings because the model will become unstable in the X2 Direction. It is also imperative to note that when modelling elastomeric bearings, on releases, only enable axial force to be compression only, the reason is elastomeric bearings cannot restrain the deck from moving upwards but will only cater for the compression force due to loading on bridge deck.
To model the laminated elastomeric bearing, use a beam element to connect the top and bottom node. Since the laminated elastomeric bearing materials is rubber and metal plates, an equivalent concrete section can be used for the beam property. Using the Young’s Modulus relationship between stress and strain, an equivalent circular concrete sectional area can be obtained using a vertical stiffness k = 420KN/mm, L = 120mm, (L-ΔL) = 29mm and E = 34 GPa mentioned above. The detailed design of elastomeric bearing should be done separately according to BS 5400 Section 9.1: 1983 using the axial forces obtained in the model.
The substructure modelling follows the same steps from 1 to 5 above to the pile caps using only nodes and beams and assigning properties as above. The outline of the pile cap is generated by copying nodes on the bottom of pier as previously implemented in step 5. However, the pile cap is modelled using plate elements. The advantage with plate elements is punching shear and slab crack width analysis can be computed unlike beam elements. To create plate elements, use Elements > Mesh > Rectangular mesh > Select the 4 nodes copied previously. One point to note, however, is to make sure the mesh divisions coincide with the positions of pier and pile end nodes for transfer of forces and moments between pile cap, piles, and piers. In the case that they do not coincide, introduce a rigid link between the pile and pile cap or use the unify command under nodes to merge the two nodes very close together into one (note this command should be used carefully, an error of merging many nodes on the model that fall within the specified range is common).
Assigning properties of the pile cap is similar to that of beams except that in the case of plate elements, a thickness of 0.75m is specified for pile cap. Pile properties are also assigned the same way as the deck just that the pile in this case is circular and can be modelled easily from selecting predefined circular section from STRAP catalogue. After defining all elements, the bridge should be looking similar to the one shown in Figure 13.
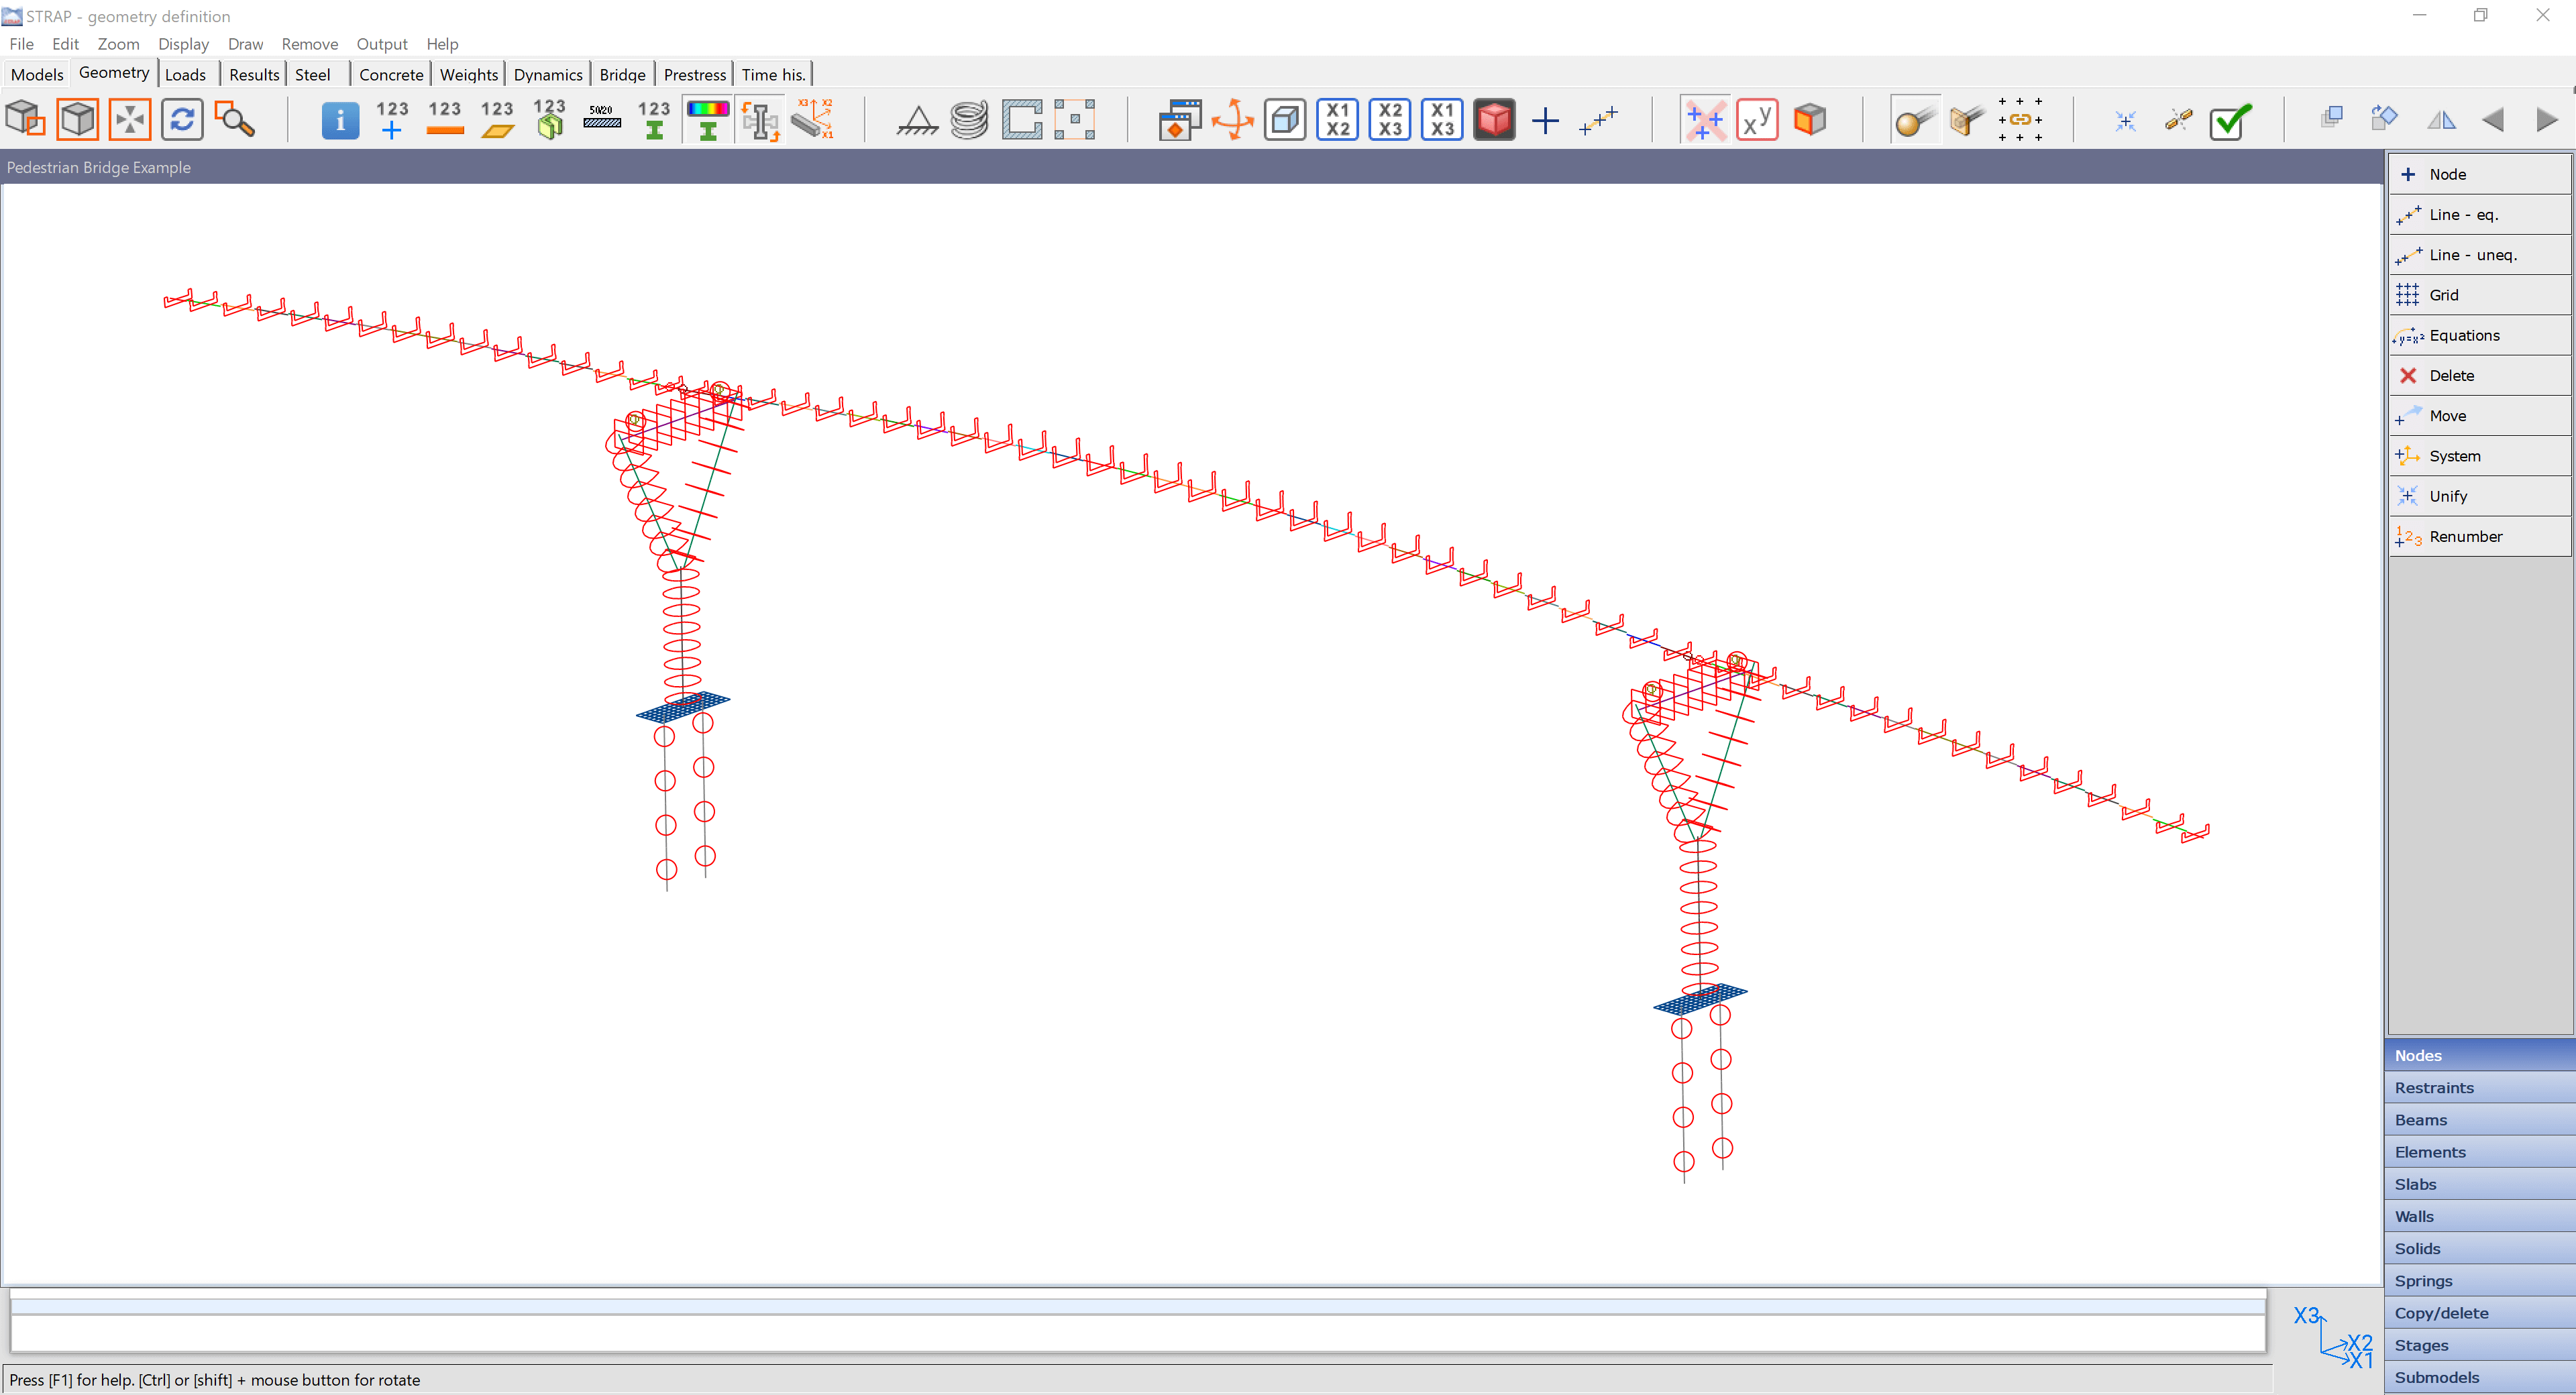
Figure 13 Full Bridge Model
Step 6: Bridge restraints definition
Entails definition of springs and support restraints. The bridge supports are as follows:
| On Actual Bridge: | In Model |
| Two Elastomeric Bearings on Abutment 1 (Span 1) | X2, X3 & X6 |
| Piles Base on Pier 1 supporting (Span 1 & 2) | Pinned |
| Piles Base on Pier 2 supporting (Span 2 & 3) | Pinned |
| Two Elastomeric Bearings on Abutments 2 (Span 3) | X2, X3 & X6 |
Table 1: Boundary Conditions
On bridge abutment supports, the elastomeric bearings can slide in the X1 (longitudinal) direction although the movement is limited due to the dowels that are installed between deck and abutment seating beam. The dowels also restrain movement in the X2 direction (transverse). The correct way to represent this on model is as indicated in Table 1 above.
The Piles are end bearing socketed 2.0m into very soft rock. The connection between the pile and very soft rock allows a certain degree of rotation hence the most conservative approach would be simulating the connection in the model with a pinned restraint. To simplify the analysis on the soil structure interaction between piles and the soil around, it is advisable to neglect the friction component of the pile and assume the pile is purely end bearing, however, the soil also restrains the pile from buckling hence it is proper to represent the soil with compression springs in the model. The subgrade modulus reaction is assumed to be uniform throughout the length of the pile with a value of 50 000KN/m³. Refer to Figure 14 for graphical representation in the model.

Figure 14 Bridge Restraints & Springs
Note that no springs have been provided on the pile cap because it is located in the zone of poor material and the bearing contribution is negligible. To introduce springs on the piles, go to springs and define springs with a coefficient mentioned above. The reason for introducing springs is that movement in the pile is restrained by the volume of soil around the pile. The soil that is directly in front of the pile movement direction braces the pile whilst the soil on the opposite side has no contribution. It is similar to the principle of passive earth pressure.
Step 7: Check geometry definition
The last step on geometry definition is to perform check geometry definition under Edit on the tool bar for confirmation of the presence of duplicate beams and elements. If there are beams and elements on top of one another, STRAP will report back highlighting all the errors.
BRIDGE LOAD DEFINITION
The 10 load cases considered for the analysis of the pedestrian bridge are as follows:
| Load Case | Load Direction (X1, X2 & X3) |
| Self-Weight | -X3 |
| Simplified Earthquake Longitudinal | X1 & -X1 |
| Simplified Earthquake Transverse | X2 & -X2 |
| Wind Loading Method B | X2 & -X2 |
| Temperature Range | X1 |
| Temperature Gradient | X3 |
| Walkway & Cycle Track | -X3 |
| Steel & Handrail Cage | -X3 |
| Bridge Supports Impact | X2 & -X2 |
| Prestress | X1 |
Table 2: Considered Load Cases
Self-Weight:
To assign loading to the structure:
- Go to the Loads tab just under Display and Draw on the toolbar.
- Click on New Load, type in Self-weight for the load case name. The bridge has both beam and plate elements.
- Click on Beam Loads > define, a pop-up window titled element load will show,
- Click on self-weight and the software will generate the self-weight of each 1m segment beam automatically using the predefined unit weight of concrete specified on assigning beam properties.
- If you intend to change the concrete unit weight, click on the models’ tab > setup > miscellaneous > materials table.
- For plate elements self-weight, the same procedure is followed instead of clicking beam load, click on element loads.
It is good practice to solve the model after applying self-weight only to check if the model is successfully running, STRAP will present all the errors if any, but most errors are as a result of model instability from boundary conditions or unconnected elements. If the model is running smoothly, then proceed to application of the other load cases.
Simplified Earthquake Longitudinal & Transverse:
For the purpose of this example, a simplified approach for earthquake loading is used. This method represents a minimum requirement for any bridge structure. It is a static method which does not accurately simulate the dynamic effects of an earthquake but may be used to ensure that the bridge has a nominal capability of resisting earthquake effects. A ground acceleration of 0.06 (TMH7 Part 2: Code of Practice for Design of Highway Bridges and Culverts in South Africa) is used because the structure is founded on piles. The acceleration is multiplied by the self-weight of the elements and applied in the X1 & -X1 for longitudinal and X2 & -X2 for transverse loading, a total of 4 load cases is expected. However, after solving the model, remember to put the longitudinal earthquake loading in one group and the transverse in another, STRAP will identify the worst effects of load in the group. This will be discussed in detail under Results. Earthquake loading is applied as a beam load in the directions mentioned above. Beam Loads > Define > Uniform Load inputting the values.
Wind Loading Method B:
Wind loading is applied as a uniform beam load the same way as earthquake loading above. It will also be a beam load but careful attention should be observed on applying the loading because deck nodes are located on the centroid of section and because the wind load also act on bridge parapets surface, an additional moment is applied which is equivalent to the lever arm (difference between parapet and deck centroid) by the force from wind which is given as 1.5KN/m² in (TMH7 Part 2: Code of Practice for Design of Highway Bridges and Culverts in South Africa).
To apply a moment on the deck, go to Beam loads > Define > Concentrated load > select by polygon > select the moment direction and magnitude as shown in Figure 15.

Figure 15 Beam Concentrated Load

Figure 16 Wind Load Parameters
Another alternative is to apply the wind load although it is challenging to do so in this example because of the varying deck parametric sections is using wind load> define a new wind load case> selected beam > beams all > input the wind load parameters as shown in Figure 16.
Temperature Range & Temperature Gradient:
Go to Beam Load > Define > Temperature load > Axial > Temperature value. Note that temperature loading in this example is not critical because the spans are simply supported. In cases where the piers were cast monolithically with the deck and any movement would cause a huge spike in Moment on the connection and down to the piles, we have to consider the temperature value. The reason for including the loading however is to predict the behavior of lateral movements/ deflections along the longitudinal direction (X1). A provision of 25mm expansion gap is provided in this example for movement of the two adjacent spans (Span 1 & 2) because of the sliding laminated elastomeric bearing. On temperature gradient, the method of application is the same but instead of choosing axial, click on X3 gradient > gradient pattern. Depending on the design code used, values of positive & negative temperature gradient will be populated. A pattern similar to that shown on Figure 17 should appear. Take note of the values for positive temperature gradient.
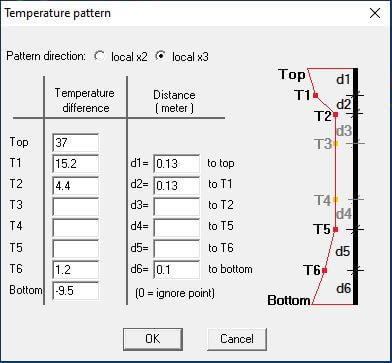
Figure 17 Temperature Gradient
Walkway & Cycle Track:
The loading for the walkway and cycle track is a uniform beam load. Go to Beam Loads > Define > Uniform Load. The maximum loading of 5KN/m² is applied on the entire 3 spans. Consideration of influence lines for alternate loading, maximum and minimum on the spans is not necessary because the spans act independently. If the bridge had continuous spans, then influence lines should be determined with relevant influence line correction factors applied as per design code. TMH7 Part 2 states that a loading of 5KN/m² is applied for spans 25m and less. If greater than 25m then use 25/√L which comes to 4.56KN/m². The load is applied as a line load, hence (2.7m x 4.56KN/m²) =12.3KN/m for center span and 13.5KN/m for the jack spans. See Figure 18 for graphical representation of load application.
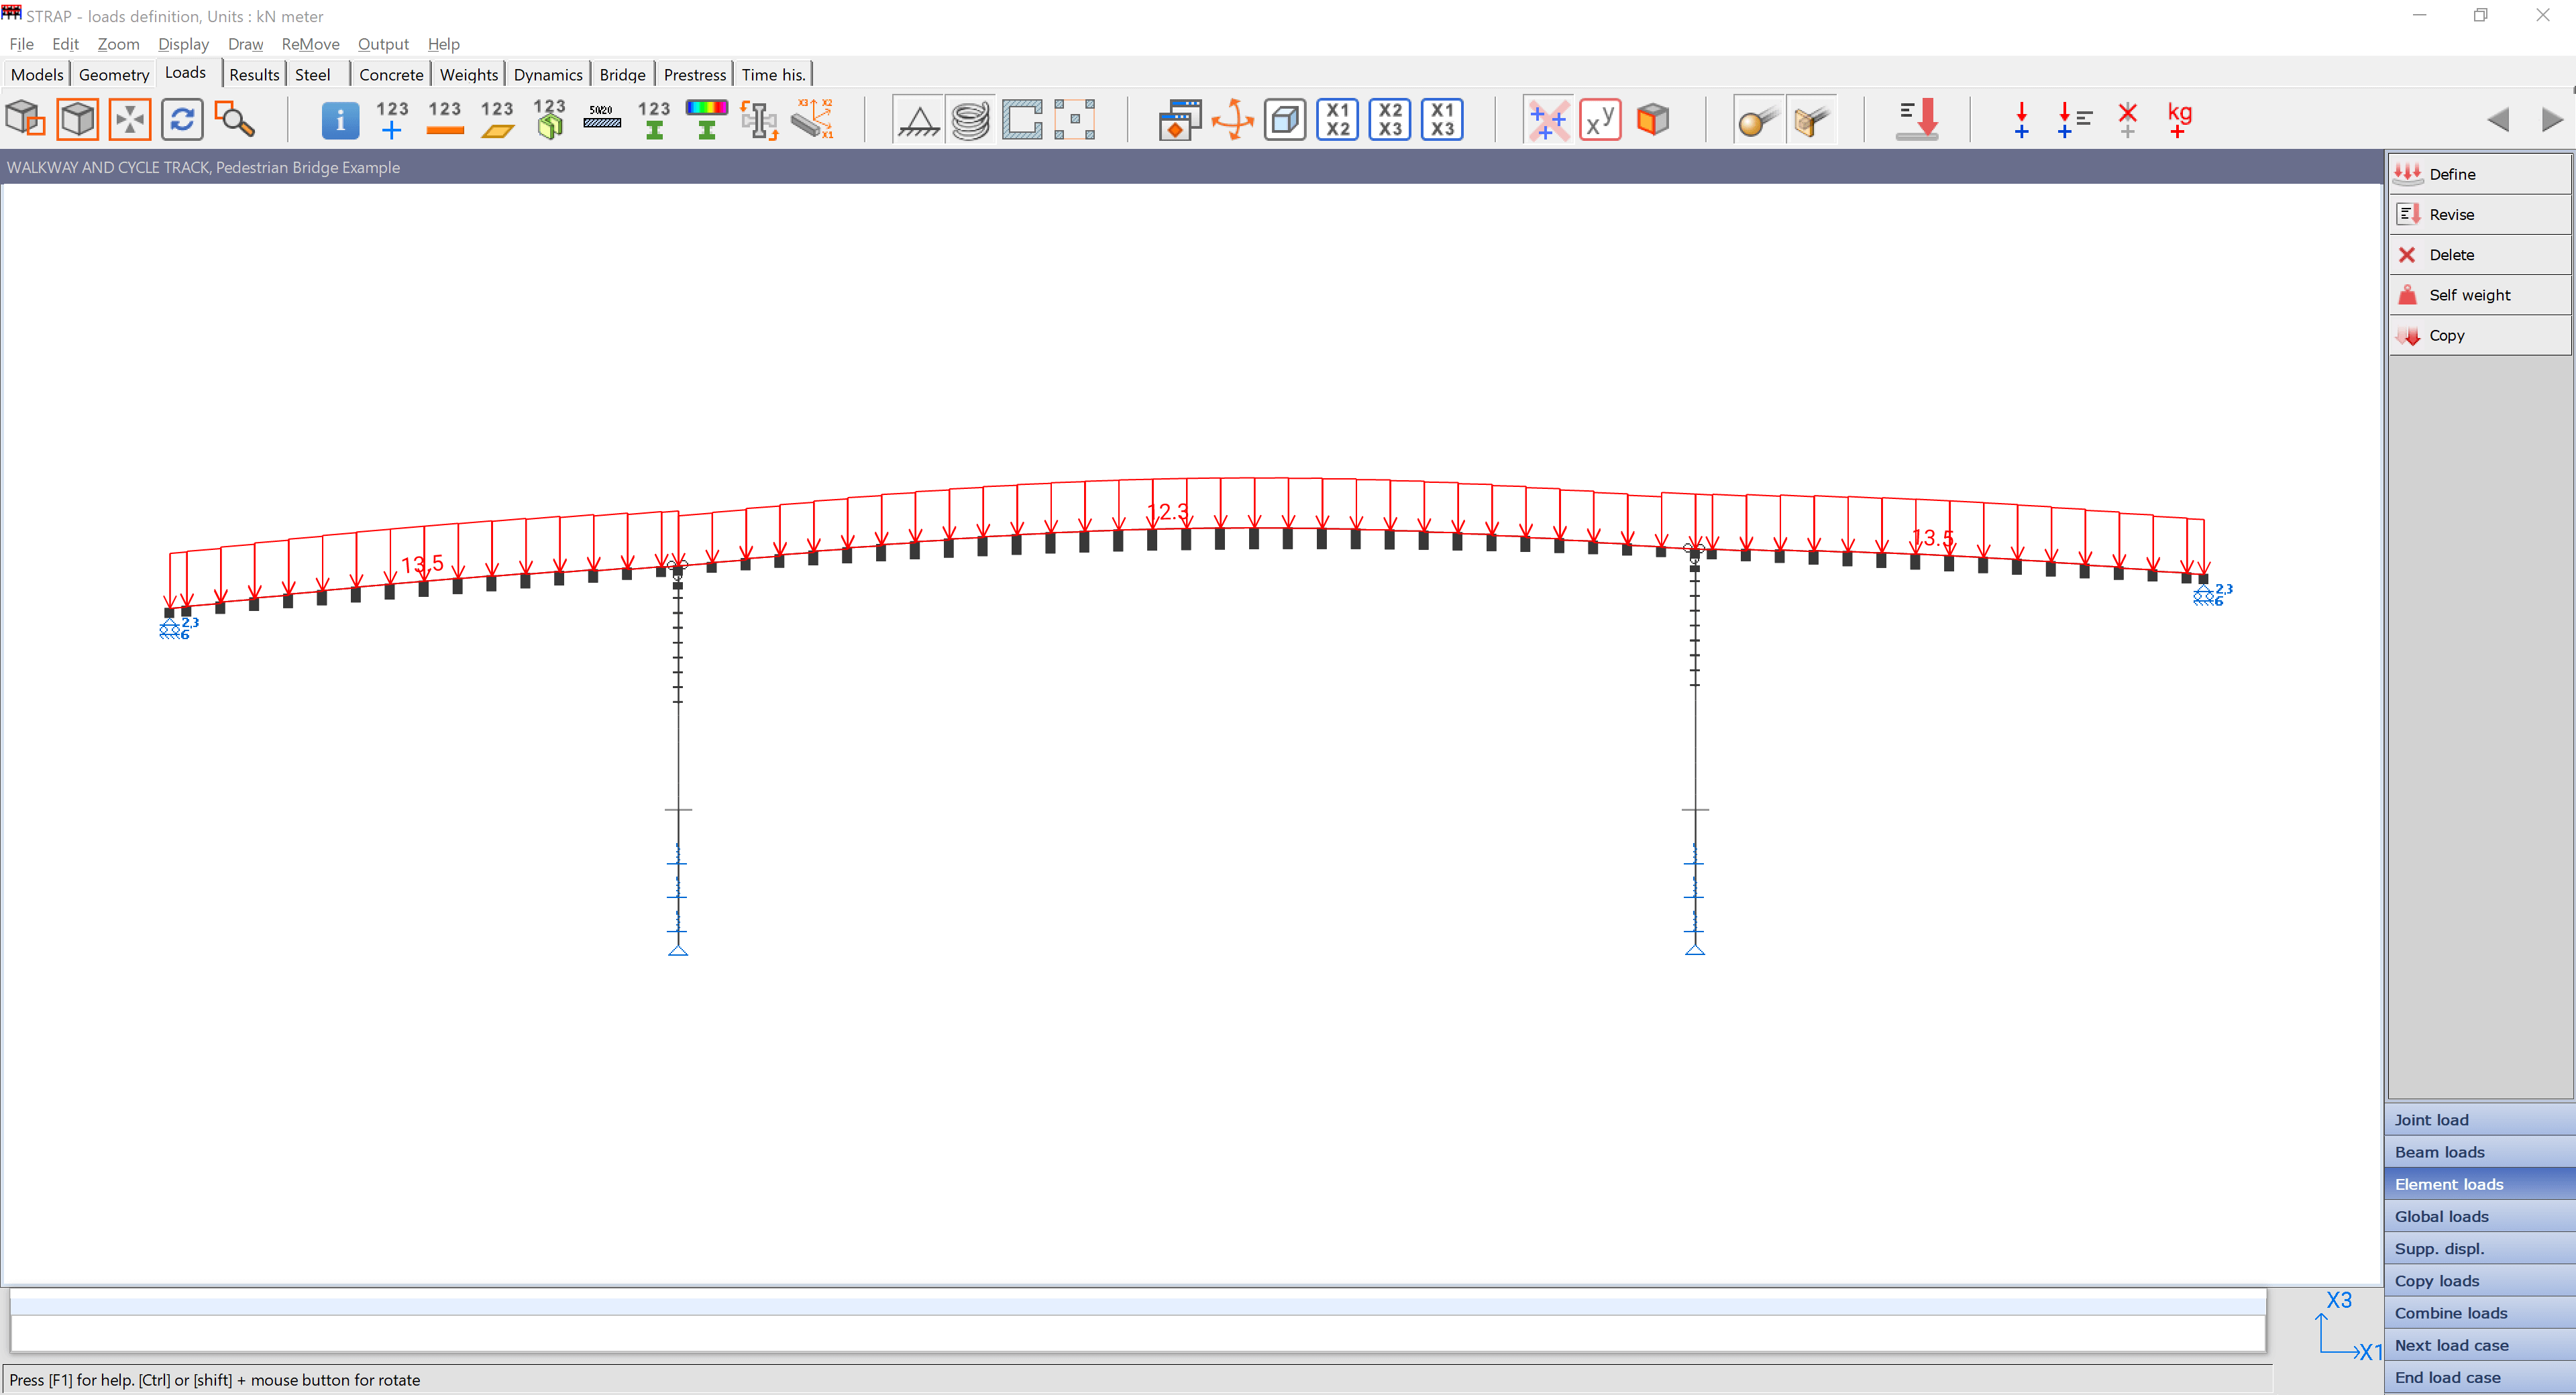
Figure 18 Walkway & Cycle Track Loading
Steel Cage & Handrail Loading:
Dead load from steel and handrail cage is very similar to how walkway and cycle track loading was applied above; the only difference is the load magnitude which will be 0.35KN/m for the entire bridge length.
Bridge Supports Impact Loading:
The Bridge impact loading is a combination of uniform beam load and a concentrated point load. The load application is similar to the steps taken on walkway and cycle track loading above. A load of 360KN in the positive X2 direction 3m on top of pile cap and a uniform load of 80KN/m in the X1 direction on two beams adjacent to the concentrated point load.
Prestress:
Prestressing will be discussed in detail in Chapter 4, but it is important to note that the central span is post tensioned and stressed from one end, therefore a temporary fix will be put on one end of the deck to the pier. The stressing force will be transmitted to the pier hence the Piers should also be designed for the lateral prestressing force.
Display Load Commands & Solving:
After applying all the loading, check if the load has been applied correctly both the magnitude and the direction of loading. This is done by clicking on Output > Display Load Commands and Applied Loads > Highlight Load Cases. A table with a summation of applied loading and direction will pop up as shown in Figure 19.
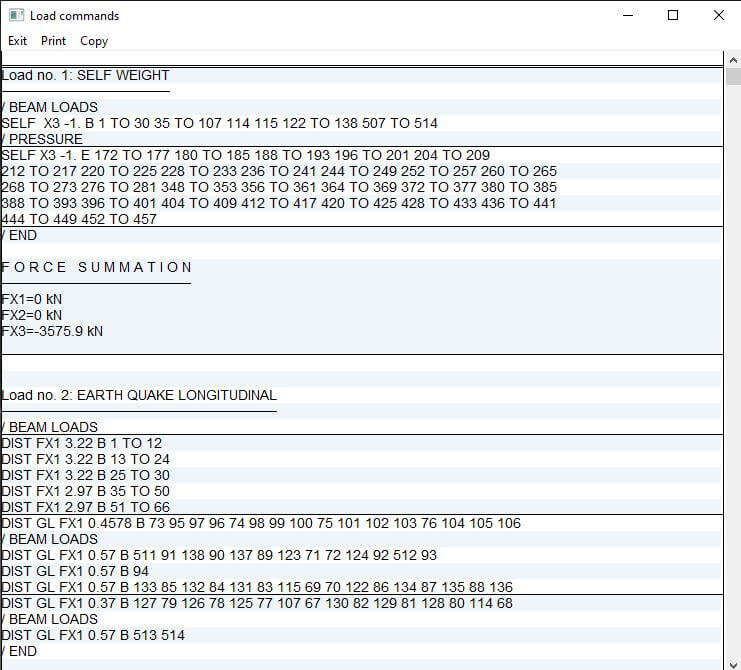
Figure 19 Load Commands
After checking the load commands, the model is solved by clicking on solve (static linear analysis). Load combinations are defined after solving the model. Before displaying results, under the results tab, click on combinations > Define/ Revise Groups to add the Earthquake Longitudinal in one group and Earthquake transverse in two separate groups. Before adding combinations, click on Combinations > Definition Options > Untick display load in groups to enable STRAP to only display load cases and groups only. Click on Combinations > Define/ Revise Combinations to add combinations. Figure 20 below shows a snippet of the combination list.

Figure 20 Combination Definition
By clicking solve, STRAP will perform static linear analysis. For the (p-delta effects or second order analysis), especially on the analysis of piers supporting the deck, click on p-delta effects on all the load cases and solve.
Soon after solving, STRAP will automatically take you to the Results tab. For moving loads from pedestrians, a detailed analysis will be performed in Chapter 5 for dynamic analysis of the bridge using Time History Analysis. However, if there are any moving loads to be introduced, make sure that the joint loading is defined as a global load so as to use moving load command in STRAP.
INTERPRETATION OF OUTPUT RESULTS
Results tab show all sorts of results are displayed ranging from immediate deflections, axial force, compression, and tensile stresses, bending moments, crack widths, shear forces, punching shear output etc. It is advisable to first save views before displaying results. This will simplify the process of viewing results and be able to isolate results. To save views, click on Zoom > Save a view. See Figure 21 below.
Figure 21 Saved Views
There are two ways to display results, draw result (graphical) or tabulated.
Draw result displays results on the model whilst tabulated displays result in a table format depending on preference. Results are displayed for individual load cases and load combinations for both beam elements and plate elements. Go to General Results > Draw Result > Beam Result Diagram > M2 (about X2 axis) > Result Plane. See Figure 22 for display of results for self-weight and Figure 23 for plate element Results. Click on Draw Result > Element Results Contour Map > Moment in X Direction.
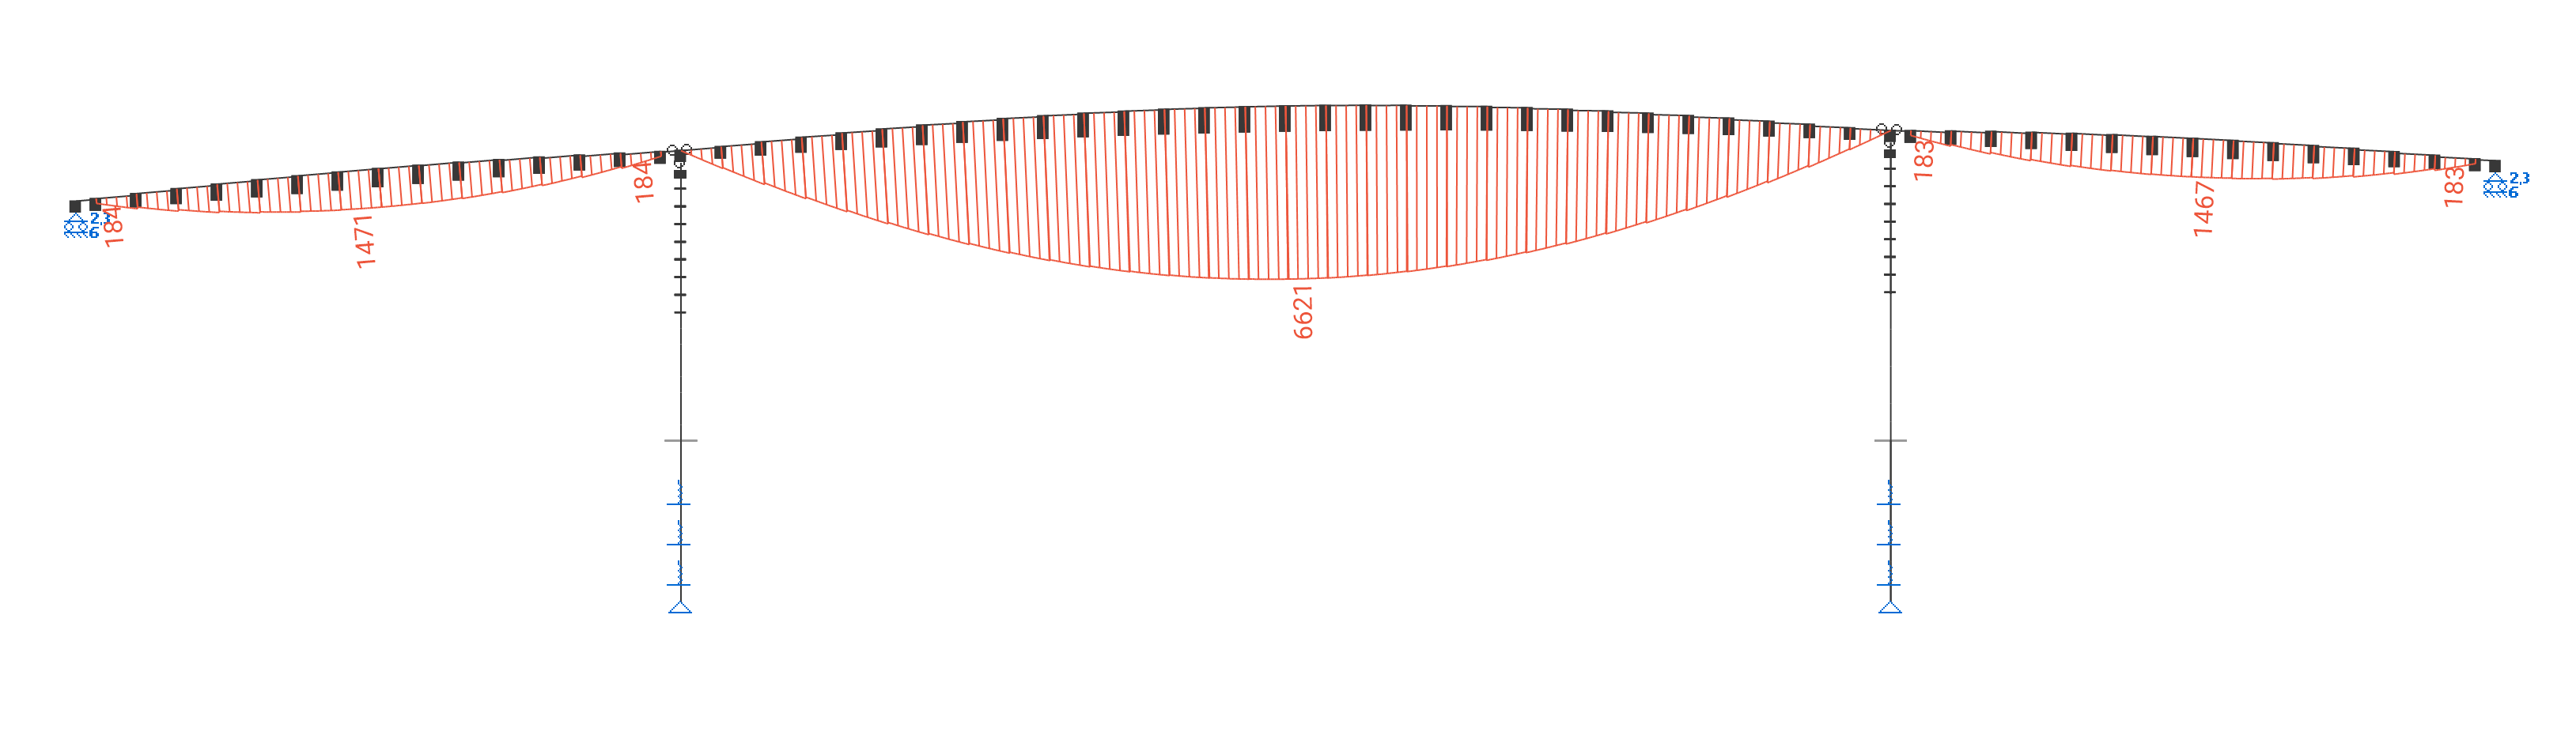
Figure 22 Beam Result Self Weight Bending Moment

Figure 23 Pile Cap Self Weight Bending Moments
Cracked Slab Deflections
STRAP can also compute cracked slab deflections for the Pile Cap analysis. The load combination list in Figure 20 includes both serviceability and ultimate limit state. For the cracked slab deflections, serviceability limit state combinations are applicable, all the other ULS design combinations can be temporarily disabled. To disable combinations, click on Combinations > Deactivate. To compute cracked slab deflections, click on Slab Defections > Solve > select combinations to compute > input creep factor of 2.5 > Display. The results show both immediate deflections, long term deflections and total deflections.
Punching Shear
STRAP also computes punching shear on plate elements. Click on Punching Shear > Select Column to identify all the connection points of pile, pier, and pile cap. After selecting the piles and pier positions, click on Punching > Display/ Edit Single Column Punching to display the output as shown in Figure 24. Make sure that the combinations for ultimate limit state combinations are active for punching shear computations.
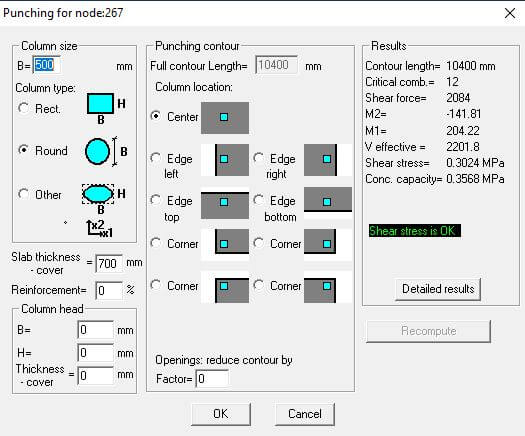
Figure 24Punching Shear
CRACK WIDTH COMPUTATIONS
STRAP also computes crack width calculations for plate elements. Crack width computations for the pile cap is computed but for the deck, a separate plate elements model will be required as mentioned at the beginning of Chapter 1. Firstly, make sure only SLS combinations are active and click on Crack width > Detailed to input crack width parameters. To view the output, click on Crack Width > Display. The crack width should not exceed 0.2mm according to TMH7 Part 3.
Concrete Pier & Pile Design:
To design the pier and pile for ultimate limit state, go to the concrete tab and click defaults to change pier parameters like bracing in the M3 and M2 direction. The load cases should be assigned as dead and live.
The other parameters to be changed are reinforcement, shear, seismic and detailing under column default parameters. The design of the column is as shown in Figure 25 below after defining the column members and computing the design,

Figure 25 Pier Stem Design
You can specify the reinforcement in the pier and then STRAP checks the capacity of the pier using the specified bars. Go to Concrete > Specify Bars. The pier however has different cross sections. The pier has one cross section from pile cap to the pier split and then the geometry changes to two split piers as shown in Figure 3. For the design of pier head, change to beam and define the beam elements. The design is performed in a similar fashion. In addition, there is an option for design of slabs, in this case the pile cap falls under slab. To compute an ultimate limit state design for the pile cap, just click of slabs > compute. STRAP provides minimum reinforcement in the pile cap if the tensile stresses in the pile cap are not severe to require heavier reinforcement.
POST TENSIONING
To commence on the post tensioning design, go to the Prestress > Define > New Beam – select start/ end. The 30m central span is post tensioned, the start beam is the first beam of the centre span and the last beam is the extreme end of beam the 30m span. When the central span is successfully defined, it should appear as in Figure 26 below:

Figure 26 Central Span Post Tension
Click on design > post cable > post tension cable definition and define the cables. For this example, use Freyssinet C27 cables on each parapet. When the two cables are defined, they will appear as shown in Figure 27. Next click on parameters to change the Creep/shrinkage, cable losses, jacking sequence and duct size. Make sure shrinkage and creep loss factor is as per modelling parameters and assumptions on section 1.1 in this document. In this case, the jacking sequence is not complicated because there are only two tendons stressed from one end. The strands 1-27 are stressed at once on both cables. Click on As by member to populate nominal top and bottom reinforcement. Post tensioning eliminates tensile stresses in the deck section but according to TMH7 Part 3, for Class 2 prestress design, a tensile stress of 2.3N/mm² is acceptable and although concrete has a certain degree of resisting tensile stresses, in design we usually assume that concrete has zero tensile stress, therefore minimum reinforcement is provided for creep and shrinkage crack control.

Figure 27 Tendon Cable definition
Click on main menu > stages definition and define the stages as shown in Figure 28 for the transfer and working stages. On load tables, define the load combinations start and end time, specify if load is permanent or temporary and if the combination is a service/ factored load. Note that prestressing is computed using service loads but for shear and torsion checks, loads should be factored.

Figure 28 Stages Definition
To solve the model for prestress, click on solve. Results can be obtained under Display tables. Results range from shear, ultimate moment, max and min deflections and stresses at top and bottom. Click on stresses at top/ bottom to display top and bottom stresses but since the span is simply supported, the center of main span is expected to have the highest in tensile stresses.
If the stresses are all black, then it means the stresses are within the specified allowable tensile and compression stresses as shown in Figure 29.
Figure 29 Stresses Output
Long term deflections and shear results can be obtained under max deflections and shear, respectively. For detailed cable losses, click on friction and draw in losses. You can also get a printout of geometry and stages data for filing of calculations in the project design report. After the model is solved, the prestress load cases are transferred automatically to the load cases, include the load cases into the load combinations to check the lateral deflections of the Piers due to the pulling force from stressing the tendons during the jacking process. The Piers should be able to withstand the pulling force from the jacking within the permissible lateral deflections.
DYNAMIC ANALYSIS
On this section, a check for the dynamic response of the pedestrian bridge due to human induced vibrations will be performed. The Eurocode BS EN 1991: 2003 outlines two possible scenarios of human induced vibrations on a pedestrian bridge which should be checked by the designer. The two scenarios are people walking and jogging on the bridge. For the purpose of this example, the first scenario for walking will be considered. Bridge class B will be considered as per Eurocode BS EN 1991:2003.
The first step is to go to the tab for Weights > Self weights to add self-weight loading to all the elements. After the weight have been applied, next step is to go to Mode shapes. Please see Figure 30 for clarity, the number of mode shapes to be calculated should be 5. The weight is to be applied in the X3 direction. The aim is to calculate the vertical acceleration in the X3 direction. Click on solve to compute the mode shapes.
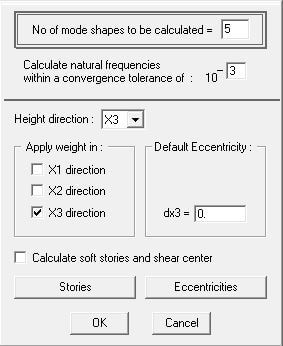
Figure 30 Number of mode shapes
After solving, STRAP automatically takes to the Dynamics tab. To display the mode shapes, go to draw modes. For all the 5 modes, all the natural frequencies are less than 5Hz especially on the center span, therefore a more detailed dynamic analysis has to be performed to check the structure for induced vibrations due to walking and jogging pedestrians. To perform the computations, time history analysis has to be implemented. Click on the time history tab to commence on the calculations. A damping coefficient for concrete of 0.04 is used. Click on new load > name “walking” > add to introduce a new loading. The joint loading to be used is 280N from Table NA.8 of BS EN 1991:2003. The load is applied on the central position of span 2. Click on History function f(t) > Sine loading > Cyclic Loading > Period (T) for mode 1 is 0.3491 > Amplitude = 1 to apply full loading. Please see Figure 31 for the history function.

Figure 31 History function for mode shape 1
Click on main menu > damping to change the damping factors for all the 5 modes is 0.04. The code BS EN 1991: 2003 states that the deck vertical acceleration should be between 0.5m/s² to 2.0m/s² before introducing the k factors specified in NA 2.44.6 of BS EN 1991: 2003. To check the vertical accelerations, click on display graphic results. Figure 32 shows the vertical accelerations in X3 direction, the amplitude stabilize at around 4 seconds and the maximum acceleration is 1.1951 m/s².
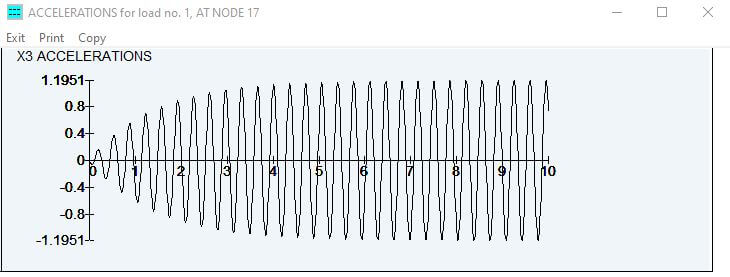
Figure 32 Accelerations in the X3 direction
Vertical deflections and velocities can also be obtained under the same display graphic results.
REFERENCES
Eurocode 1: Action of Structures – Part2: Traffic Loads on Bridges. EN 1991-2.
Freyssinet: The C’Range Post Tensioning System.
BS 5400 – 9.1: 1983 Steel, concrete and composite bridges Part 9: Bridge Bearings – Code of practice for design of bridge bearings.